R for Entrepreneurial Finance
R
From completing Duke University's Entrepreneurial Finance: Strategy and Innovation Specialization on Coursera, I learned the basics of R and applied it to financial statistics.
 |
| Using R to simulate generate ten one-day outcomes for a 10-day holding period |
📖 Upgrades: R interface, R statistical analysis using packages, financial risk/return calcs
💻 Platforms: RStudio, Coursera
⏰ Est. Time Req.: 15.5 hrs (5.5 class+ 10 troubleshooting)
Background
R came into my life when I enrolled in the Coursera specialization offered by Duke University, Entrepreneurial Finance: Strategy and Innovation Specialization, in March 2020. The last course in the Specialization is Financial Risk Management with R, which walks a student through using R programming to calculate the return of a stock portfolio as well as quantify the market risk of that portfolio. I had just finished another course on financial accounting and I wanted to educate myself further on financial strategy in the entrepreneurial world. Why not? COVID-19 had just put everything on pause, spun the markets in flux, and given me time to upgrade myself.
Ironically, the virus was positive pressure for me to learn a skill I had considered since 2017/2018, a time period in which I began thinking more broadly about applications of data. At that time, I was working at Toyota R&D. As with most engineering companies, we heavily used MATLAB, a fantastic tool for numerical analysis. I kept seeing articles mentioning Python and R when I browsed through articles and posts on the rise of big data and AI. Content with my engineering arsenal, I was hesitant about investing more time into another analytics tool. I knew, though, that from my career interests, it would benefit me to just do it.
 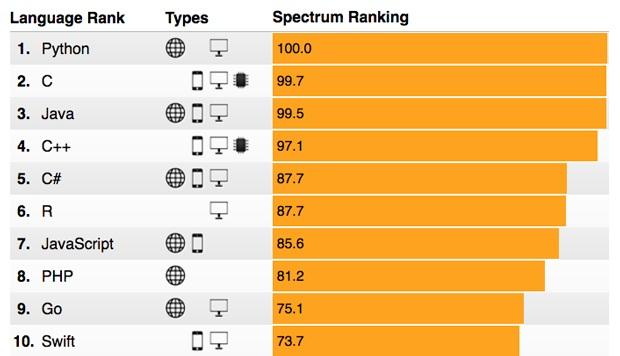 |
| IEEE spectrum Top 10 programming language 2020 according to their popularity |
I will say that R is by no means the ONLY tool one interested in a data-driven career should learn. I chose it out of self-reflection on my personal, extracurricular, and career goals. This flowchart was very helpful (and FUN!) to me for a broader view of the coding paths. I am also planning on diving into Python too once I become comfortable with R. The great thing about mastering one software language first is that those fundamentals are transferable to any others. Besides, I needed it to pass my course and in my research on R's applications, I realized I could use it for much more than a MOOC. In the meantime, R it is!
Learnings
Basic
- Setup: I configured R in macOS Mojave v10.14.6. As I will point out in the 'Troubleshooting' section, operating R on a Mac turned out to be a handicap at first that took some time to overcome.
- IDE: I chose RStudio based on the recommendation of the course. Once I poked around in RStudio, I realized it is very analogous to the MATLAB environment. In fact, reflecting on how I would "do it" in MATLAB became a common thought and helped me get through the tedious parts of familiarizing myself with R. For example using the concept of scripting .R files in R is similar to scripting .m files in MATLAB, installing packages in R is similar to installing toolkits in MATLAB, and the list goes on.
- Support: Through troubleshooting my operating system compatibility, I became a member of Rstudio Community and StackOverload, two sites that I highly recommend joining if you become remotely serious about learning R. These resources are great if you get stumped on a R problem and need help. The goodwill of R enthusiasts is so heartwarming. Everyone wants to support learning together. In the same vein, the CRAN project is a repository of most packages and binaries you'll have to download.
Advanced
- Course outcomes: Lectures and exercises revolved around computing inferences from indexes such as the Wilshire 5000, which represents a portfolio that invests in every single stock that trades in the U.S. equity market. The portfolio is valuated, which means that, the portfolio holds the amount of each stock in proportion to their market capitalization. We worked with such data from FRED at the Federal Reserve Bank of St. Louis that goes as far back as 1979. On a breakdown of module descriptions:
- Week 1: Understanding how to pull data from FRED and calculate returns.
- Week 2: How to calculate value-at-risk (VaR) and expected shortfall (ES) when returns are normally distributed.
- Week 3: How to test for normality of returns, and how to calculate VaR and ES when returns are not normally distributed.
- Week 4: How to test for the presence of volatility clustering and how to calculate VaR and ES when returns exhibit volatility clustering.
- Real world application: Why does this all matter? Well, it helps us with financial management. Let's say I have a fund of $1B in the Wilshire 5000 Index (one day......). I want to know what kind of decisions I should make given market movements. Let's invoke just one of the metrics covered in class, VaR. VaR is the amount that a portfolio might lose with a given probability which is called one minus Alpha (a.k.a. the confidence level) over a given time period. Alpha is usually set to be 1%, 5%, 10% and the time period is usually one day. So if Alpha is 5%, I'd use the VaR to estimate the maximum loss of the portfolio over the next day, if we exclude the worst 5% of all possible outcomes. For example, if I use R to calculate the one day VaR at the 95% confidence interval level at -1.7%, then over one day, there is a 95% probability that the fund will not lose more than $17.1M, or a 5% probability that the fund will lose more than $17.1M. Pretty cool, huh? Or, for small time investors, you can stick with just the basic R calculations of returns if evaluating your own indexes to get an idea of the historical trends of the market.
- Statistical tools: Throughout each week, I invoked various packages that enabled calculations for financial metrics. Packages included quantmod, moments, MASS, metRology, and rugarch. While using each one, I often had to troubleshoot and read about their functionality. The professor went into detail for each function, but really, the beauty of each one came with their application. For instance, often, we are interested to find out what may happen farther than one day into the future. When this happens, we need to simulate different time horizons. The MASS package helped us do that.
Troubleshooting
- Quantmod: I will never forget the pains I experienced from setting up on a Mac just to complete the first assignment requiring quantmod. It's not as easy as just installing R and an R IDE. I spent hours on figuring out the correct support required and ended up posting multiple times on the course's discussion forum, which was no help. The setup problems I faced were not addressed by the professor at all except that he recommended installing R 3.5.1 and to watch out for more recent versions that will require additional lines of code to run commands. The moderators of the course forum were also not available. So, students with Macs were swimming in confusion. Things turned around when I posted on RStudio Community. With some help on this platform, I figured out that I need to download compiler files to run R per the instructions here. And even as I followed the instructions and tried installing quantmod again, I had to chase down a solution posed in GitHub that described needing to install X11 too per the recommendation of R bloggers. The final step to quantmod, after yet another round of forum hunting, was installing curl. After this step, I restarted R and was able to install quantmod. My final sequence of steps just to use R, after installing R and RStudio, for the class was the following:
- Install
- Xcode
- GNU Fortran 8.2
- Mandatory Library tools
- xz utils
- pcre2
- XQuartz (X11)
- Curl
- Restart RStudio
- Rugarch: My inability to install this last package prevented me from completing the last week of coursework for a bit of time. I spent a couple of days cruising around forums pertaining to the error it gave me regarding RcppArmadillo and associated compiling errors (ex. ERROR: compilation failed for package ‘RcppArmadillo’). Finally, after I pinged for help on RStudio Community, I was recommended to install to the most updated R version available. Apparently the latest version does not require a custom compiler, so it should be simpler. Current builds and higher no longer use any custom compilers and thus this directory is no longer relevant. As such, I upgraded all my software to those on CRAN (most available is 4.0.1.pkg) here. Then, I was able to install 'rugarch' and dependent packages. I only had to watch out afterwards, as later I found out, that If you are using R version 3.6.0 or higher you need to add the following command BEFORE setting the seed value: RNGkind(sample.kind=”Rounding”) when calculating VaR and ES.
Next Step
After four weeks worth of grinding through the course, I finished it and received its certificate. With that final class complete, I was awarded my first Coursera specialization series certificate. These certificates were pleasing to receive, but the knowledge I gained from slugging through R was the real gain- well worth the struggle. It's these small victories that keep us going forward.
I look forward to counting my self-exploration using some free online sources such as Hands-On-Programming with R by Garrett Grolemund. Also, from a recommendation during a virtual networking session devoted to breaking into the world of data, I am going to pursue reading and working through R for Data Science by Garrett Grolemund and Hadley Wickham.
I look forward to counting my self-exploration using some free online sources such as Hands-On-Programming with R by Garrett Grolemund. Also, from a recommendation during a virtual networking session devoted to breaking into the world of data, I am going to pursue reading and working through R for Data Science by Garrett Grolemund and Hadley Wickham.
 |
| R for Data Science by Garrett Grolemund and Hadley Wickham |
I have an array of projects I want to complete too for my volunteering activities in climate change activism. For example, already, I have began using R for analysis of our volunteer demographics in our database. It has also been a great way to filter for activists based on parameters such as zip code.

Comments
Post a Comment